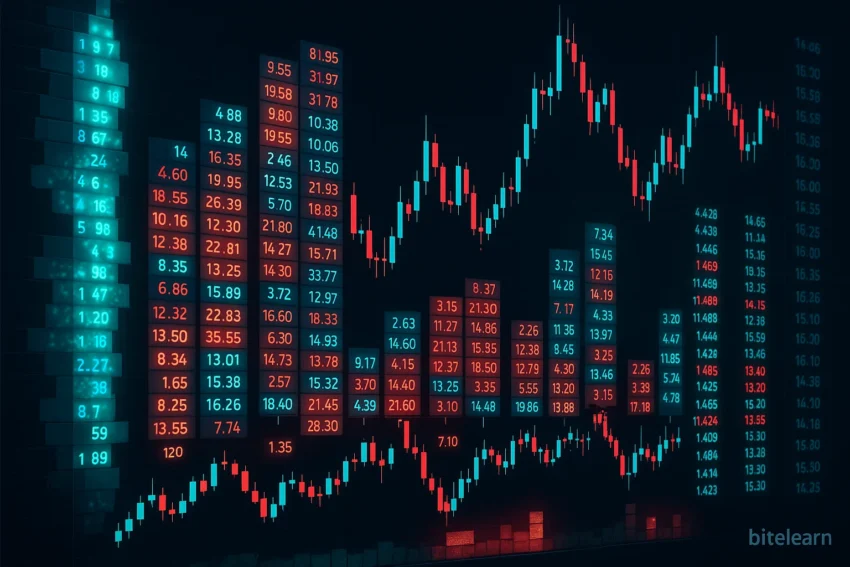
For many traders, market analysis is centered on the price chart. They use technical indicators, trendlines, and chart patterns to forecast future price movements. This is a powerful and valid approach, but it is ultimately a study of the past, an analysis of price action that has already occurred.
A more advanced and proactive discipline, known as order flow analysis, seeks to understand the market in real-time by analyzing the “tape”, the stream of buy and sell orders being executed at the present moment. This technique, born in the fast-paced trading pits of Chicago and now adapted for the digital age, provides a granular, real-time view of the battle between buyers and sellers, offering powerful clues about the market’s immediate intentions.
Beyond the Candlestick: What is Order Flow?
A traditional candlestick chart provides four pieces of information for a given time period: the open, high, low, and close price. An order flow chart, by contrast, shows the volume of actual buy and sell orders that were executed at each individual price level within that candlestick. This provides a much deeper understanding of the market’s dynamics.
For example, a candlestick might close with a long wick on the top, suggesting that sellers pushed the price down. An order flow analysis of that same candle might reveal that a massive number of buy orders were absorbed at the top of that wick, indicating that large buyers were actively accumulating positions at that level, a potentially bullish sign that is completely invisible on a standard chart.
Key Tools for Order Flow Analysis
Analyzing order flow requires specialized tools that can visualize this complex data in an intuitive way.
- The Footprint Chart: This is the most common tool. It is a candlestick chart where each candle is broken down to show the volume of buy (ask) and sell (bid) orders that traded at each price. This allows a trader to see exactly where the most aggressive buying and selling occurred.
- The Volume Profile: This is a histogram that is plotted on the vertical axis of the chart, showing the total volume traded at each price level over a specific period. It helps to identify “high-volume nodes” (areas of high agreement on price, which often act as strong support or resistance) and “low-volume nodes” (areas where the price moved quickly, indicating a lack of interest).
- The Time and Sales (The “Tape”): This is a raw, scrolling feed of every single trade that is executed, showing the time, price, and size of the trade. Learning to “read the tape” is a skill that allows a trader to feel the real-time pace and pressure of the market.
This deep dive into the mechanics of price movement is a significant step beyond introductory Technical Analysis.
Identifying Absorption and Exhaustion
Two of the most powerful concepts in order flow trading are absorption and exhaustion.
Absorption: This occurs when a large, aggressive seller is hitting the market, but the price refuses to move lower because an even larger, passive buyer is “absorbing” all of the sell orders. On an order flow chart, this would appear as a high volume of sell orders at a specific price level, but the price repeatedly fails to break below it. This is a powerful sign that a market bottom is forming.
Exhaustion: This is the opposite. It occurs at the end of a strong trend, when the momentum begins to wane. On an order flow chart, this might appear as the price making a new high, but on very low volume, indicating that there are no more aggressive buyers left to push the price higher. This is often a sign that the trend is exhausted and a reversal is imminent.
Order Flow in a Multi-Asset World
The principles of order flow analysis are universal and can be applied to any liquid market where volume data is available, from forex and futures to cryptocurrencies.
For traders who operate across multiple markets, understanding order flow can provide a consistent analytical framework. However, accessing high-quality order flow data and the specialized software to analyze it has historically been expensive and difficult. Today, modern brokerage platforms are beginning to integrate these professional-grade tools into their offerings.
A platform like the YWO trading platform, which offers a range of sophisticated account types, is at the forefront of democratizing access to these advanced analytical techniques, allowing retail traders to use the same tools as institutional professionals. By learning to read the tape, a trader can move from simply reacting to price to anticipating it, a crucial step in the journey to consistent profitability.

Vanna Berkey is a young, ambitious woman who has a passion for blockchain technology and cryptography. She has been working in the cryptocurrency industry since she was 18 years old, and is an expert in blockchain algorithms. Vanna is determined to use her knowledge and skills to make a positive impact on the world.

