
For traders venturing into the world of technical analysis, the beginning can be overwhelming. The sheer number of available indicators, from moving averages to oscillators, can lead to a cluttered chart and a state of “analysis paralysis.”
However, there exists a single, comprehensive indicator that is designed to be an all-in-one system for identifying trends, gauging momentum, and pinpointing key levels of support and resistance: the Ichimoku Kinko Hyo, or Ichimoku Cloud. Developed in Japan in the late 1930s by Goichi Hosoda, this elegant system provides a deep, multi-layered view of the market, offering a more complete picture of price action than most other indicators combined.
The Five Components of the Ichimoku System
The Ichimoku Cloud is composed of five distinct lines, each providing a different piece of information.
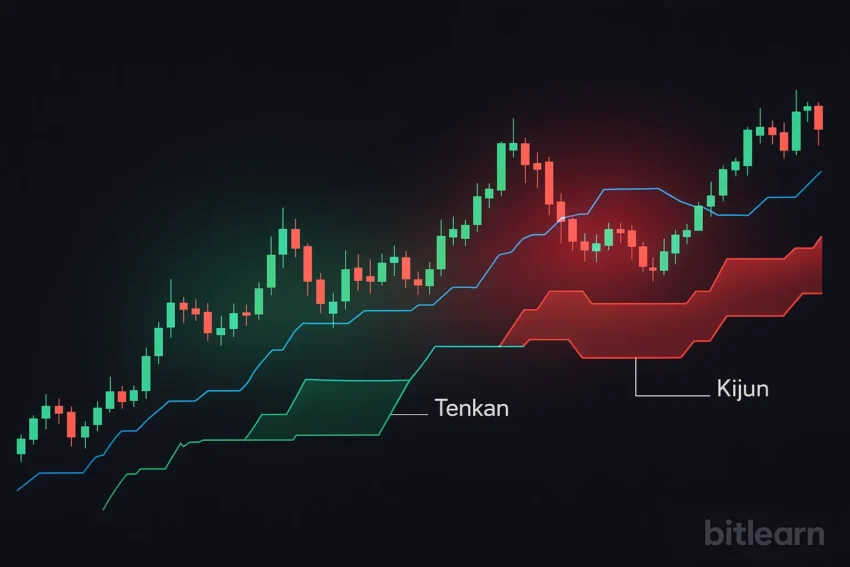
- Tenkan-sen (Conversion Line): Calculated as the midpoint of the last 9 periods’ high and low. This is the fastest-moving line and acts as a short-term momentum indicator.
- Kijun-sen (Base Line): Calculated as the midpoint of the last 26 periods’ high and low. This is a slower-moving line that acts as a measure of medium-term trend and a key level of support or resistance.
- Senkou Span A (Leading Span A): Calculated as the average of the Tenkan-sen and Kijun-sen, but plotted 26 periods ahead of the current price.
- Senkou Span B (Leading Span B): Calculated as the midpoint of the last 52 periods’ high and low, also plotted 26 periods ahead of the current price.
- Chikou Span (Lagging Span): This is simply the current closing price plotted 26 periods behind the current price.
The “Kumo” or Cloud: The Heart of the System
The most distinctive feature of the Ichimoku indicator is the “Kumo,” or Cloud, which is the area between Senkou Span A and Senkou Span B. The Cloud is the heart of the system and serves several crucial functions.
Trend Identification: When the price is trading above the Cloud, the overall trend is considered bullish. When the price is trading below the Cloud, the trend is bearish. When the price is inside the Cloud, the market is considered to be in a state of consolidation or indecision. The color of the Cloud (determined by whether Span A is above or below Span B) also indicates the strength of the trend.
Dynamic Support and Resistance: The boundaries of the Cloud act as powerful, dynamic levels of support and resistance. In an uptrend, the top of the Cloud will often serve as a first level of support, with the bottom of the Cloud providing a second, stronger level. The thickness of the Cloud also matters; a thick Cloud represents a strong area of support or resistance, while a thin Cloud is a weaker area.
Generating Trading Signals with Ichimoku
The Ichimoku system generates trading signals through the interaction of its five components. The most classic signal is the “Tenkan-Kijun cross.” A bullish signal is generated when the faster Tenkan-sen crosses above the slower Kijun-sen, especially when this occurs above the Cloud.
A bearish signal is generated when the Tenkan-sen crosses below the Kijun-sen, especially below the Cloud. The Chikou Span (Lagging Span) is used as a confirmation tool. For a bullish signal to be confirmed, the Chikou Span should be trading above the price from 26 periods ago, with nothing obstructing its path. This layered approach to signal generation is a core principle of advanced Technical Analysis.
A Holistic View of the Market
The true beauty of the Ichimoku Cloud is that it provides a complete, at-a-glance view of the market. In a single indicator, a trader can see the trend, the momentum, and key areas of support and resistance, both current and future. This holistic approach can help to filter out the “noise” of less significant price movements and allow a trader to focus on the bigger picture. For traders who operate across different asset classes, from forex to crypto, the principles of Ichimoku can be applied to any liquid market.
A platform that offers advanced charting capabilities, like the YWO trading platform, is essential for utilizing a complex, multi-component indicator like the Ichimoku Cloud effectively. By taking the time to learn this comprehensive system, a trader can add a powerful and versatile tool to their analytical arsenal, providing a deeper and more nuanced understanding of market dynamics.
Author

Vanna Berkey is a young, ambitious woman who has a passion for blockchain technology and cryptography. She has been working in the cryptocurrency industry since she was 18 years old, and is an expert in blockchain algorithms. Vanna is determined to use her knowledge and skills to make a positive impact on the world.