
In early 2018, I watched my crypto portfolio grow to seven figures during the bull run, only to lose over 80% of its value in the following bear market. Why? Because I had no real risk management strategy. I was just another overconfident trader who confused a bull market with personal genius.
Fast forward five years—I’ve survived multiple market cycles, two major exchange collapses, and countless pumps and dumps. The difference between success and failure in this space isn’t about predicting the next moonshot. It’s about having robust risk management systems that keep you in the game long enough to catch the inevitable waves.
The harsh reality is that approximately 90% of crypto traders lose money. The 10% who consistently profit aren’t necessarily better at picking winners—they’re simply better at managing risk. In this article, I’ll share the ten risk management strategies that transformed my approach to crypto trading and have kept me profitable through bull and bear markets alike.
Table of Contents
- Position Sizing: The 1-2% Rule
- Stop-Loss Strategy: Predetermined Exit Points
- Portfolio Diversification: Strategic Asset Allocation
- Risk-Reward Ratio: The 1:3 Minimum
- Trading Journal: Systematic Performance Tracking
- Volatility-Based Position Sizing
- Correlation Risk Management
- Drawdown Limits: Circuit Breakers for Your Trading
- Stress Testing Your Strategy
- Psychological Risk Management
- FAQ: Risk Management Questions
- Conclusion: Building Your Risk Management System
Position Sizing: The 1-2% Rule
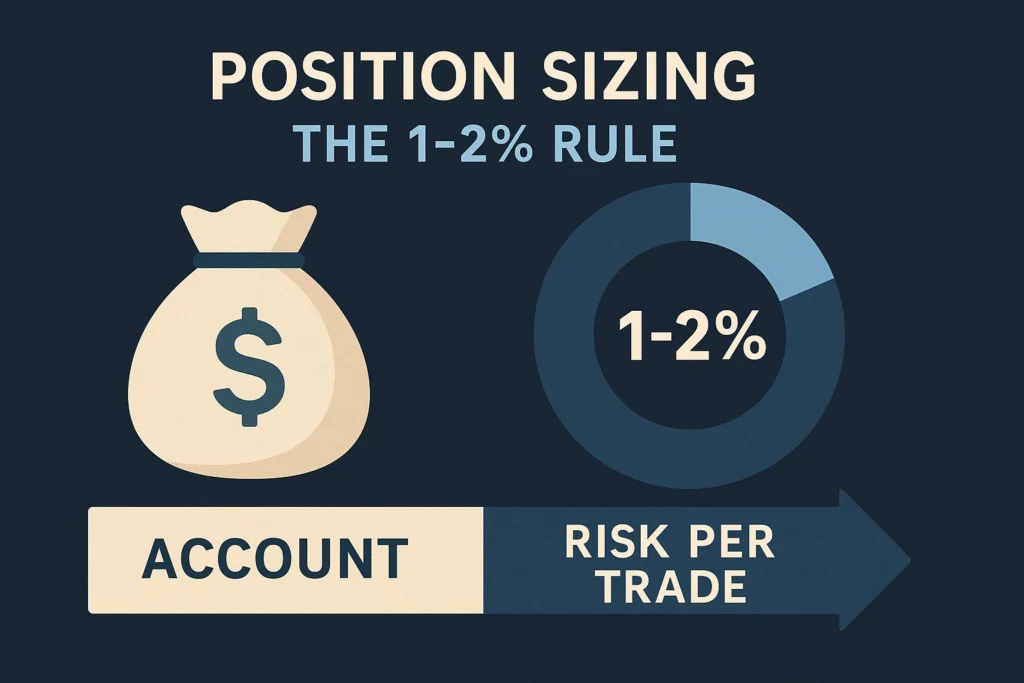
The single most powerful risk management tool in your arsenal is proper position sizing. No matter how confident you are in a trade, unexpected events can and will happen in the crypto market.
Why Position Sizing Matters
When I first started trading, I would routinely put 20-30% of my portfolio into a single position. One bad trade could—and did—wipe out weeks of gains. After painful lessons, I adopted the 1-2% rule: never risk more than 1-2% of your total trading capital on a single trade.
Implementing the 1-2% Rule
Here’s how to calculate your position size using the 1-2% rule:
- Determine your total trading capital (e.g., $10,000)
- Decide on your risk percentage per trade (e.g., 1% = $100)
- Identify your stop-loss percentage (e.g., 5% below entry)
- Calculate your position size:
Position Size = Risk Amount / Stop-Loss Percentage
For example:
- Risk amount: $100 (1% of $10,000)
- Stop-loss: 5%
- Position size: $100 ÷ 0.05 = $2,000
This means you would invest $2,000 in this trade, which is 20% of your capital. If the price drops 5%, you’ll lose $100, which is exactly 1% of your total capital.
Position Sizing Calculator
| Risk Tolerance | Portfolio Size | Stop-Loss % | Max Position Size |
|---|---|---|---|
| Conservative (1%) | $10,000 | 5% | $2,000 |
| Conservative (1%) | $10,000 | 10% | $1,000 |
| Moderate (2%) | $10,000 | 5% | $4,000 |
| Moderate (2%) | $10,000 | 10% | $2,000 |
This simple tool has saved my portfolio countless times. During the UST/LUNA collapse in 2022, I had a position in LUNA. Despite believing in the project, my position sizing meant that when it imploded, I lost only 1.5% of my total portfolio instead of a devastating amount.
Stop-Loss Strategy: Predetermined Exit Points
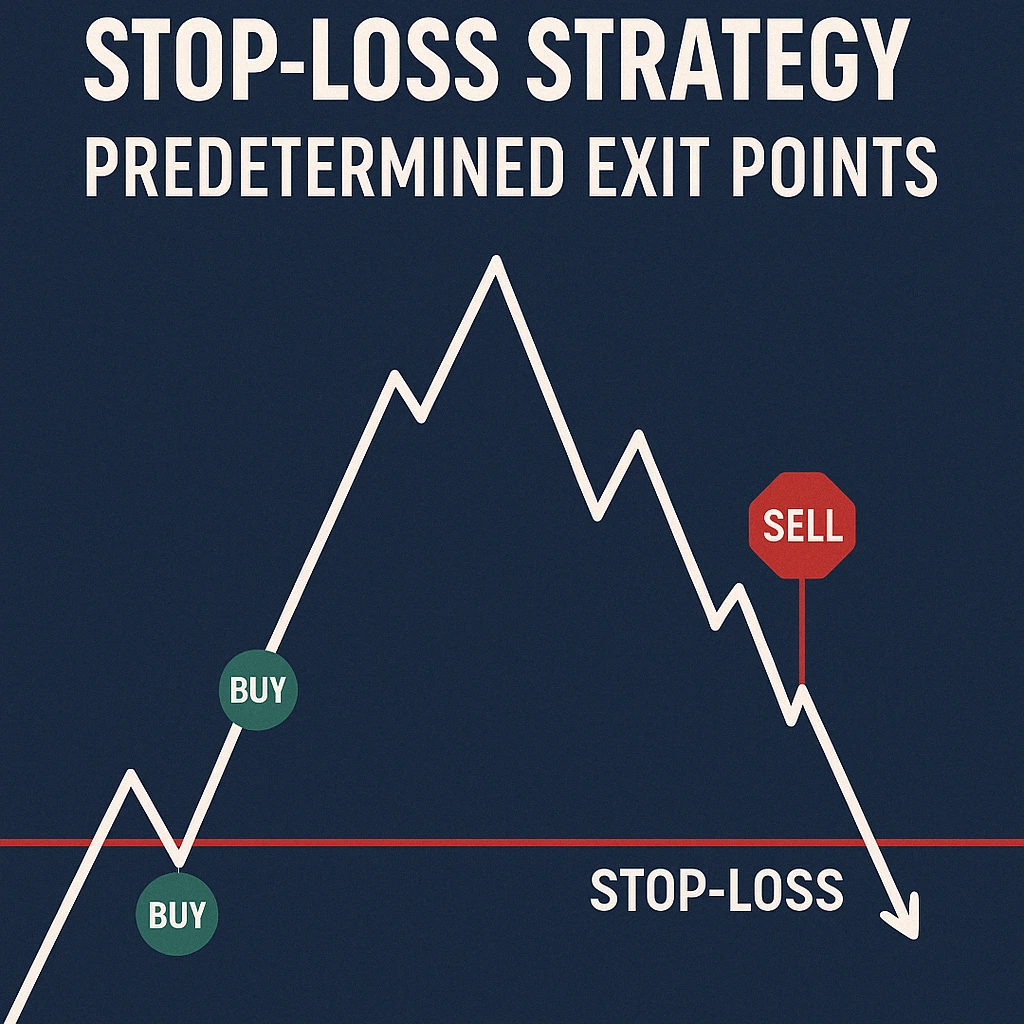
A stop-loss is a predetermined price point at which you’ll exit a position to prevent further losses. Despite its simplicity, many traders either don’t use stop-losses or move them during trades—a recipe for disaster.
Types of Stop-Loss Strategies
Fixed Percentage Stop-Loss
Set your stop-loss at a fixed percentage below your entry point. For beginners, 5-10% is often appropriate, while experienced traders might use tighter 2-5% stops for certain strategies.
Technical Analysis Based Stop-Loss
Place your stop-loss just below key support levels, moving averages, or other technical indicators. This approach is more sophisticated but can provide better protection against being stopped out by normal market volatility.
Volatility-Based Stop-Loss
Use indicators like Average True Range (ATR) to set stops based on the asset’s actual volatility. For example:
Stop-Loss Price = Entry Price - (ATR × Multiplier)
Where the multiplier is typically 2-3 for crypto assets.
Trailing Stop-Loss
A dynamic stop-loss that moves up as the price increases, locking in profits while providing downside protection. I’ve found this particularly effective in crypto bull markets.
Stop-Loss Placement Examples
| Strategy Type | Entry Price (BTC) | Stop-Loss Calculation | Stop-Loss Price |
|---|---|---|---|
| Fixed 5% | $50,000 | $50,000 × 0.95 | $47,500 |
| Support Level | $50,000 | Recent support at $48,200 | $48,000 |
| ATR (100) | $50,000 | ATR = $1,500, Multiplier = 2 | $47,000 |
| Trailing (5%) | $50,000 → $55,000 | $55,000 × 0.95 | $52,250 |
Stop-Loss Execution: Mental vs. Actual
A mental stop-loss (where you plan to sell manually when price hits your limit) might seem sufficient, but market moves happen rapidly in crypto. I’ve found that actually placing the stop-loss order is crucial—especially when trading on leverage or in highly volatile markets.
Most exchanges offer stop-limit orders that automatically trigger when your predetermined price is reached. Use them.
Portfolio Diversification: Strategic Asset Allocation

Diversification in crypto requires a different approach than traditional finance. The high correlation between cryptocurrencies means simple diversification across many coins often provides less protection than expected.
Effective Crypto Diversification Framework
By Layer and Function
| Category | Allocation Example | Purpose | Example Assets |
|---|---|---|---|
| Layer 1 Blockchains | 40% | Core infrastructure | BTC, ETH, SOL, ADA |
| DeFi Protocols | 20% | Financial services | UNI, AAVE, MKR |
| Layer 2 Solutions | 15% | Scalability plays | OP, ARB, MATIC |
| Web3/Metaverse | 10% | Future applications | LINK, FIL, THETA |
| Stablecoins | 15% | Risk reduction/dry powder | USDC, DAI |
By Market Capitalization
- Large Cap (>$10B): 50-60%
- Mid Cap ($1B-$10B): 25-35%
- Small Cap (<$1B): 10-15%
By Risk Profile
- Conservative (BTC, ETH, stablecoins): 50-60%
- Moderate (established alts): 30-40%
- Speculative (small caps, new projects): 5-10%
Rebalancing Strategy
Periodic rebalancing is essential to maintain your target allocation as prices fluctuate. I recommend quarterly rebalancing for most traders, with additional rebalancing when any single position exceeds 150% of its target allocation.
When I stuck to my diversification plan during the 2021 bull run, I naturally took profits on outperforming assets and reallocated to underperforming ones. This meant I sold portions of SOL and LUNA near their peaks while adding to BTC when it underperformed—a counterintuitive move that paid off significantly during the subsequent bear market.
Risk-Reward Ratio: The 1:3 Minimum
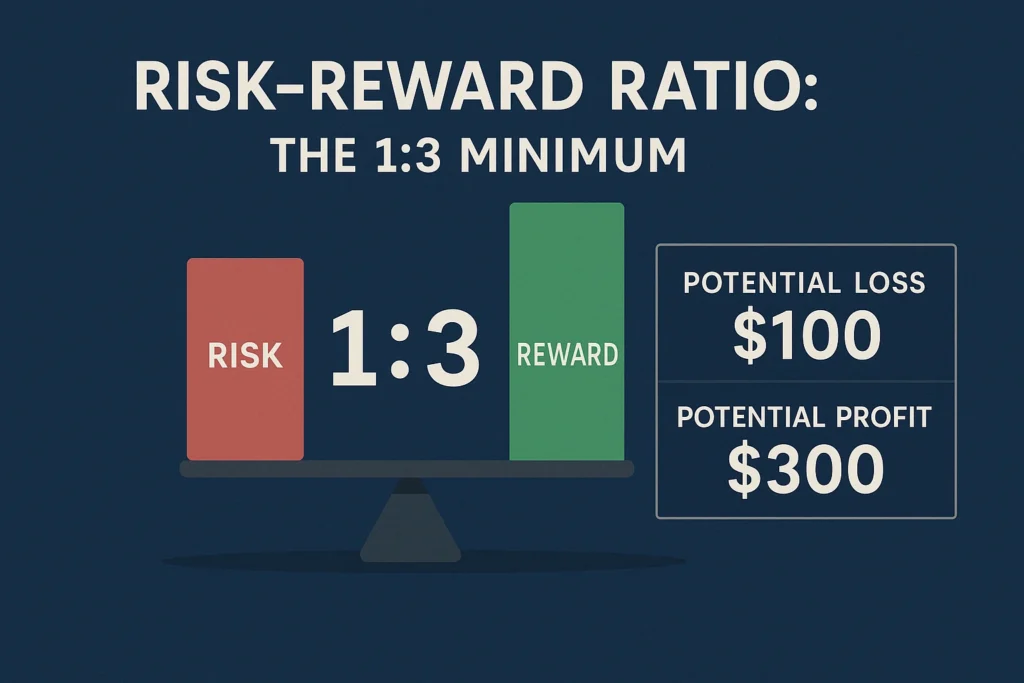
The risk-reward ratio compares what you’re risking on a trade to what you stand to gain. This simple concept is fundamental to long-term profitability.
Calculating Risk-Reward Ratio
Risk-Reward Ratio = Potential Loss / Potential Profit
For example, if you buy BTC at $50,000 with a stop-loss at $48,000 (risking $2,000) and a target of $56,000 (potential profit of $6,000):
Risk-Reward = $2,000 / $6,000 = 1:3
Why 1:3 Is the Minimum
With a 1:3 risk-reward ratio, you can be wrong on two out of three trades and still break even:
- Lose $2,000 on first trade
- Lose $2,000 on second trade
- Win $6,000 on third trade
- Net result: $2,000 profit
This mathematical reality means you don’t need to be right all the time—just often enough.
Implementing Risk-Reward Analysis
Before entering any trade, clearly define:
- Entry price
- Stop-loss level
- Profit target
If the ratio isn’t at least 1:3, skip the trade. There will always be better opportunities.
During the 2022 bear market, I became extremely selective about my trades, insisting on a minimum 1:5 risk-reward ratio. This higher standard meant fewer trades but significantly better performance on the ones I did take.
Trading Journal: Systematic Performance Tracking
A trading journal is your personal feedback loop—the difference between repeating mistakes and continuous improvement.
Essential Trading Journal Components
Trade Details
- Entry and exit prices
- Position size
- Date and time
- Trading pair
- Strategy employed
Performance Metrics
- P/L (absolute and percentage)
- Holding period
- Risk-reward ratio
- Maximum drawdown during trade
Analysis Fields
- Pre-trade analysis and rationale
- Post-trade evaluation
- Psychological state
- Market conditions
- Lessons learned
Sample Trading Journal Entry
Trade #137:
Date: 2023-04-15
Pair: ETH/USDT
Entry: $1,950
Stop-Loss: $1,900
Target: $2,100
Position Size: $4,000
Strategy: Breakout from consolidation

Pre-Trade Analysis:
ETH consolidating below $1,950 for two weeks. Volume increasing with bullish divergence on 4H RSI. BTC showing strength above $29K.

Result:
Exit: $2,080
P/L: +6.7% ($268)
Hold Time: 37 hours
Max Drawdown: -1.2%

Post-Trade Analysis:
Exit was premature; price continued to $2,150. Need to implement trailing stops for breakout trades. Strong conviction but weak execution.

Mental State:
Somewhat anxious due to previous loss. Led to early profit-taking.

Lesson:
Implement mechanical trailing stop rather than manual exit for trends.
Journal Analysis and Improvement
Review your journal monthly and quarterly to identify patterns:
- Which strategies have the highest win rate?
- What time frames work best for you?
- Are there emotional patterns affecting performance?
- What’s your average risk-reward on winning vs. losing trades?
My personal breakthrough came when I analyzed six months of trades and discovered my win rate on impulse trades was just 22%, while my researched, planned entries had a 68% success rate. This insight alone improved my performance dramatically.
Volatility-Based Position Sizing
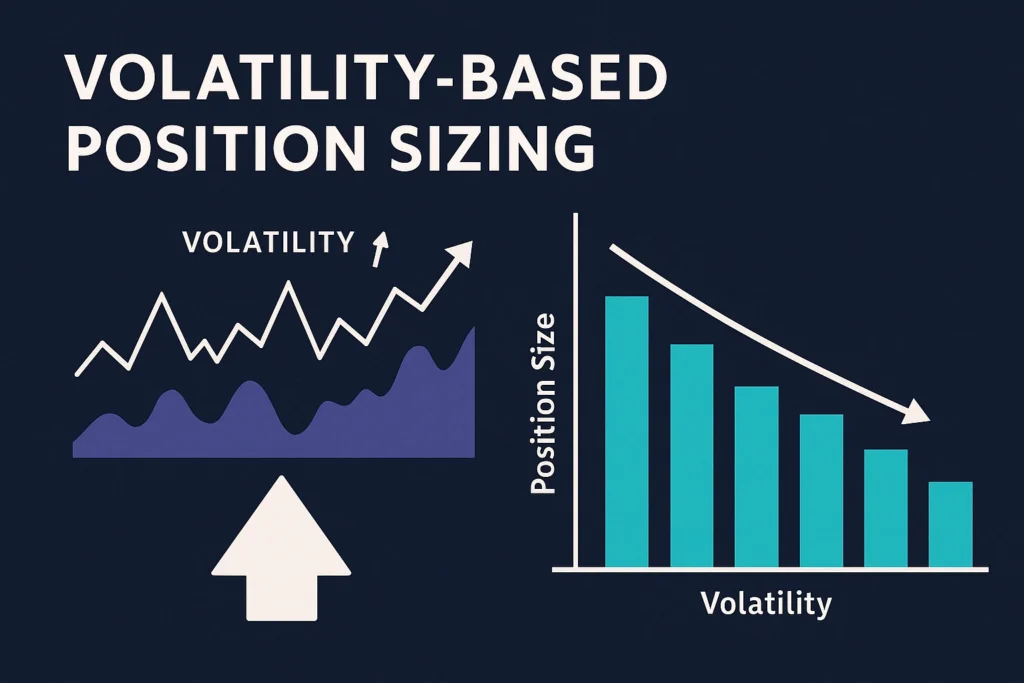
Standard position sizing doesn’t account for the varying volatility between different cryptocurrencies. Bitcoin and altcoins with the same percentage stop-loss have very different actual risk profiles.
The Volatility Adjustment Method
- Calculate the asset’s Average True Range (ATR)
- Compare it to your benchmark (often BTC)
- Adjust position size inversely to relative volatility
Volatility Ratio = Asset ATR / Benchmark ATR
Adjusted Position Size = Base Position Size / Volatility Ratio
Practical Example
If ETH has an ATR of 3.5% and BTC has an ATR of 2.5%:
- Volatility Ratio = 3.5% / 2.5% = 1.4
- If your standard position size is $1,000, for ETH it would be $1,000 / 1.4 = $714
Volatility-Adjusted Position Size Table
| Asset | 20-Day ATR | Volatility Ratio vs BTC | Standard Position | Adjusted Position |
|---|---|---|---|---|
| BTC | 2.5% | 1.0 | $1,000 | $1,000 |
| ETH | 3.5% | 1.4 | $1,000 | $714 |
| SOL | 6.0% | 2.4 | $1,000 | $417 |
| AVAX | 7.5% | 3.0 | $1,000 | $333 |
| Small Cap Alt | 12.0% | 4.8 | $1,000 | $208 |
This approach has saved me countless times when trading volatile altcoins. During the 2021 bull market, I used volatility-adjusted sizing for my SOL position. When it experienced a 35% flash crash in September, my position was sized such that the drawdown remained within my risk tolerance, allowing me to hold through the dip before it resumed its uptrend.
Correlation Risk Management
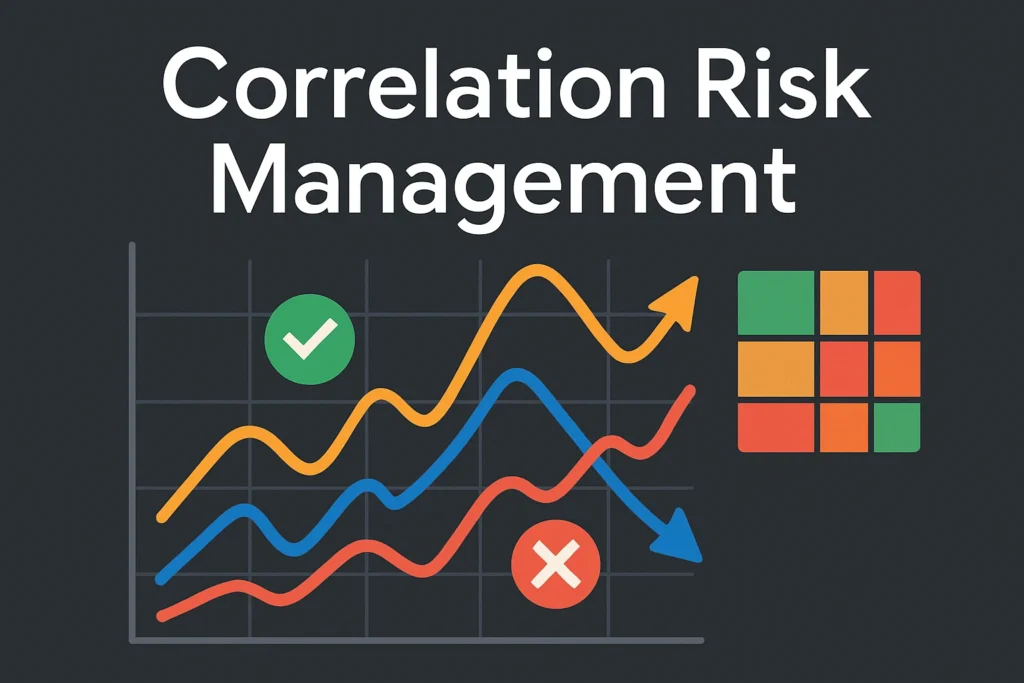
Crypto assets often move together, which means apparent diversification can be illusory.
Understanding Correlation in Crypto
Correlation coefficients range from -1 (perfect negative correlation) to +1 (perfect positive correlation):
- +0.8 to +1.0: Strong positive correlation
- +0.5 to +0.8: Moderate positive correlation
- +0.2 to +0.5: Weak positive correlation
- -0.2 to +0.2: Little to no correlation
- -0.5 to -0.2: Weak negative correlation
- -0.8 to -0.5: Moderate negative correlation
- -1.0 to -0.8: Strong negative correlation
Most major cryptocurrencies have correlations between 0.7-0.9 with Bitcoin during market stress.
Correlation Matrix Example
| Asset | BTC | ETH | SOL | LINK | USDC |
|---|---|---|---|---|---|
| BTC | 1.00 | 0.85 | 0.82 | 0.76 | 0.05 |
| ETH | 0.85 | 1.00 | 0.88 | 0.79 | 0.07 |
| SOL | 0.82 | 0.88 | 1.00 | 0.73 | 0.04 |
| LINK | 0.76 | 0.79 | 0.73 | 1.00 | 0.08 |
| USDC | 0.05 | 0.07 | 0.04 | 0.08 | 1.00 |
Managing Correlation Risk
- Identify Correlation Clusters Group assets that move together (e.g., L1 chains, DeFi tokens, exchange tokens)
- Treat Clusters as Single Exposure If SOL, AVAX, and ADA are highly correlated, treat them as one position for risk purposes
- Seek True Diversifiers
- Privacy coins often have lower correlation to BTC
- Stablecoins provide zero correlation
- Some tokenized commodities (PAXG) offer negative correlation during certain market conditions
- Use Correlation-Based Position Sizing Scale down positions in highly correlated assets:
Cluster Position Limit = Max Single Position × Correlation AdjustmentWhere correlation adjustment decreases as average intra-cluster correlation increases.
During the 2022 bear market, I reduced my combined allocation to all L1 alternatives (SOL, AVAX, ADA, etc.) to 15% of my portfolio after observing their 0.9+ correlation during the downturn, effectively treating them as a single risk unit.
Drawdown Limits: Circuit Breakers for Your Trading
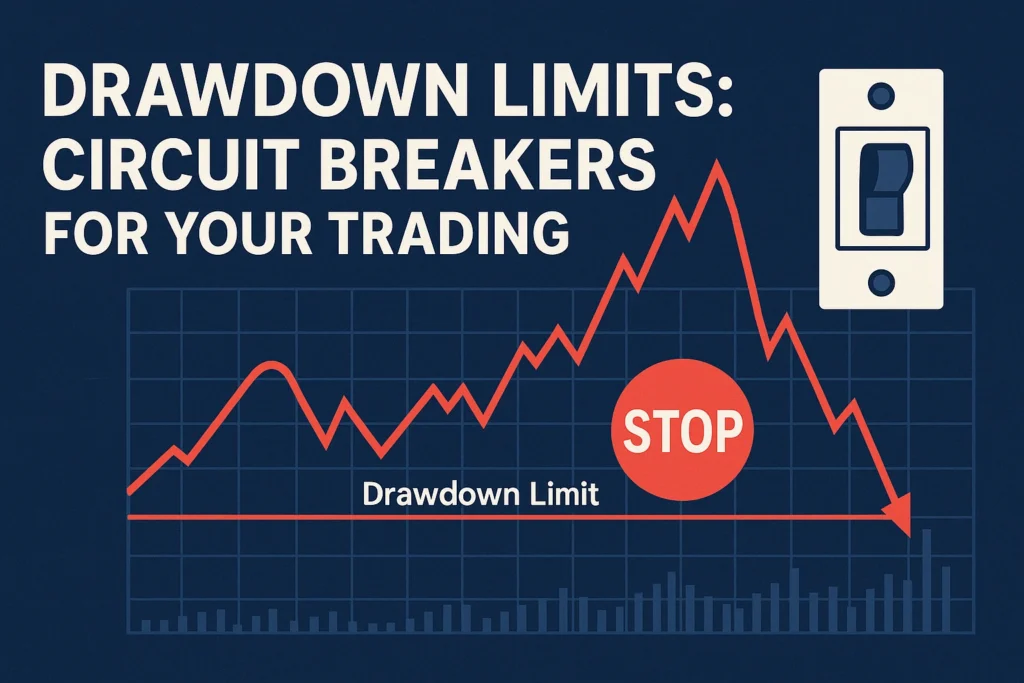
Implementing maximum drawdown limits acts as a circuit breaker to prevent catastrophic losses during adverse market conditions.
Types of Drawdown Limits
Daily Drawdown Limit
Stop trading for the day if you lose X% of your portfolio. For most traders, 3-5% is appropriate.
Weekly Drawdown Limit
Reduce position sizes by 50% if weekly losses exceed X%. Consider a 7-10% weekly limit.
Monthly Drawdown Limit
Take a trading break and reevaluate your strategy if monthly losses exceed X%. A 15-20% monthly drawdown limit is reasonable.
Maximum Total Drawdown
The absolute limit for portfolio drawdown before making significant system changes. Typically 30-40% for crypto portfolios.
Drawdown Response Protocol
| Drawdown Level | Action Required |
|---|---|
| Daily >3% | No new positions for 24 hours |
| Weekly >7% | Reduce position size by 50% for next week |
| Weekly >12% | Paper trade only for one week |
| Monthly >20% | Full trading pause; strategy review |
| Total >30% | Major system overhaul; mentor consultation |
In October 2021, I implemented a 5% daily drawdown limit. When I hit this threshold during a market correction, I stopped trading for the rest of the day. The next day, the sell-off intensified, and because I wasn’t overtrading during the panic, I had both the capital and emotional capacity to buy the dip effectively.
Stress Testing Your Strategy
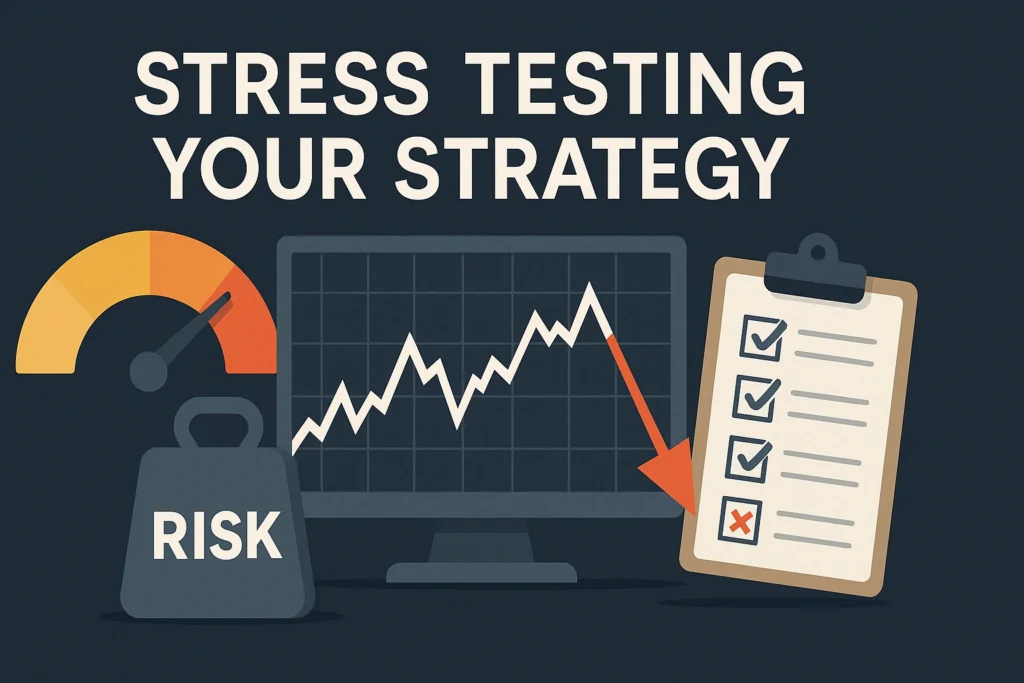
Stress testing involves simulating extreme market conditions to see how your strategy and risk management system would perform.
How to Stress Test Your Crypto Portfolio
Historical Scenario Analysis
Replay your current strategy through historical market crashes:
- 2018 Bear Market (>80% drawdown)
- March 2020 COVID Crash (50% in two days)
- May 2021 Crash (53% Bitcoin drop)
- 2022 Terra/Luna Collapse
- FTX Bankruptcy Impact
Monte Carlo Simulations
Use computational algorithms to generate thousands of possible market scenarios based on historical volatility patterns, then analyze how your strategy performs across these simulations.
Correlation Breakdown Testing
Test what happens if historical correlations break down—for example, if Bitcoin crashes but your altcoins crash harder than expected.
Black Swan Scenarios
Test extreme but plausible scenarios:
- Major exchange hack or insolvency
- Regulatory crackdown in key markets
- Protocol failure or smart contract exploit
- Stablecoin depeg
Sample Stress Test Results
| Scenario | Portfolio Impact | Risk Management Response |
|---|---|---|
| 50% BTC Drop | -37% Portfolio Value | Reduce position sizes, increase stablecoin allocation |
| Major Exchange Hack | -15% Portfolio Value | Distribute assets across more exchanges and cold storage |
| Stablecoin Depeg | -12% Portfolio Value | Diversify stablecoin holdings across different backing mechanisms |
| Correlation Spike to 0.95 | -45% in Market Crash | Increase non-correlated assets, implement asymmetric hedging |
In early 2022, I stress-tested my portfolio against a stablecoin depeg scenario. As a result, I reduced my USDT exposure and redistributed to USDC and DAI. When UST collapsed in May 2022, my diversified stablecoin approach saved me from significant losses.
Psychological Risk Management
Trading psychology is perhaps the most underrated aspect of risk management. The best systems fail if emotional decision-making overrides them.
Common Psychological Biases in Crypto Trading
FOMO (Fear Of Missing Out)
Signs: Entering positions after significant price increases, buying based on social media hype. Management: Pre-define entry criteria; maintain a watchlist with target entry zones.
Loss Aversion
Signs: Refusing to close losing positions, moving stop-losses. Management: Pre-commit to stop-losses; use automated rather than manual stops.
Overconfidence Bias
Signs: Increasing position sizes after wins, ignoring risk parameters. Management: Stick to position sizing rules regardless of recent performance.
Anchoring Bias
Signs: Fixating on purchase price or previous highs/lows. Management: Focus on current market structure and levels rather than historical prices.
Psychological Circuit Breakers
Implement personal rules that force a “cooling-off” period:
- 17-Hour Rule: Wait 17 hours before trading after a significant loss (overnight plus time to recalibrate)
- 3-Trade Rule: After three consecutive losing trades, take 48 hours off from active trading
- Emotion Scale: Rate your emotional state from 1-10 before trading; don’t trade if below 4 or above 8
- Physical Triggers: Don’t trade if you haven’t slept well, are hungry, or feel unwell
Building Mental Resilience
- Trading Journal: Document emotional states alongside trades
- Meditation Practice: Develop emotional awareness
- Peer Group: Maintain relationships with level-headed traders
- Regular Breaks: Schedule time away from charts
In the May 2021 crash, I found myself becoming increasingly anxious as Bitcoin dropped through support levels. Rather than panic-selling, I followed my psychological circuit breaker rule: I closed the charts, took a 24-hour break, and returned with a clearer mind to make strategic adjustments rather than emotional reactions.
FAQ: Risk Management Questions
How do I determine the right risk percentage per trade for my situation?
Answer: The appropriate risk per trade depends on several factors including your experience level, portfolio size, and trading style. Here’s a general framework:
- Beginners (< 1 year experience): 0.5-1% risk per trade
- Intermediate (1-3 years): 1-2% risk per trade
- Advanced (3+ years): Up to 3% for highest conviction trades
I recommend starting at the lower end of these ranges and only increasing as you demonstrate consistent profitability over at least 50 trades. Remember that even professional traders rarely risk more than 3% per position—there’s simply no need to risk more when proper position sizing and leverage can achieve your goals with less risk.
Should I use the same risk management approach for both bull and bear markets?
Answer: No, you should adapt your risk management to market conditions. During confirmed bull markets, you can:
- Slightly increase risk per trade (e.g., from 1% to 1.5%)
- Use wider stop-losses to accommodate volatility
- Implement trailing stops to capture trends
- Consider more volatile altcoin allocations
During bear markets:
- Reduce risk per trade (e.g., from 1% to 0.5%)
- Use tighter stop-losses
- Increase your cash/stablecoin position
- Focus on shorter timeframe trades
- Require higher risk-reward ratios (minimum 1:4)
I’ve found that adjusting my risk exposure to match the market cycle has been crucial for long-term survival in crypto.
How do I handle risk management for long-term holds versus active trades?
Answer: Long-term holdings and active trades require different risk approaches:
For long-term holdings (1+ year horizon):
- Position sizing should be based on total portfolio percentage (e.g., 5-20% for core holdings)
- Instead of stop-losses, use rebalancing thresholds
- Set fundamental invalidation criteria rather than price levels
- Consider dollar-cost averaging both in and out
For active trades (days to weeks):
- Apply the 1-2% risk rule strictly
- Use technical analysis-based stop-losses
- Have clearly defined profit targets
- Set maximum holding periods
I maintain separate allocations for my long-term “conviction” holdings (60% of portfolio) and my active trading capital (40%). This separation prevents trading activity from affecting my core long-term investment strategy.
What’s the best way to manage risk when trading with leverage?
Answer: Leverage amplifies both gains and losses, making risk management even more critical. My guidelines for leveraged trading:
- Reduce your base risk percentage by the leverage factor
- Example: If you normally risk 1% per trade, with 5x leverage, risk only 0.2% of account
- Always use stop-losses – no exceptions
- Calculate your liquidation price and ensure it’s far from current price
- Monitor funding rates for perpetual futures
- Have a deleveraging plan if market moves against you
- Avoid maximum leverage offered by exchanges (10x is typically the maximum I’d recommend even for experienced traders)
After losing significantly on leveraged positions in 2018, I now follow the “Rule of 3” – my effective leverage (accounting for position size and actual leverage) never exceeds 3x my standard risk.
How can I protect my portfolio from exchange risk?
Answer: Exchange risk is often overlooked but potentially devastating. My strategy:
- Exchange diversification: Split assets across 3-4 reputable exchanges
- Hardware wallet storage: Keep 60-80% of long-term holdings in cold storage
- Exchange selection criteria:
- Proof of reserves/transparency
- Insurance funds
- Security track record
- Regulatory compliance
- Regular withdrawal schedule: Move trading profits to cold storage monthly
- 2FA and security best practices on all accounts
When FTX collapsed in 2022, my exchange diversification strategy meant I had less than 5% of my total portfolio on the platform—a significant but not devastating loss.
Conclusion: Building Your Risk Management System
Risk management isn’t just a set of rules—it’s a comprehensive system that must become second nature. The strategies I’ve outlined represent the culmination of expensive lessons learned through multiple market cycles.
Implementation Roadmap
- Start with the fundamentals: Position sizing and stop-losses
- Add one new strategy every two weeks: Gradually build your system
- Document everything: Create and maintain your trading journal
- Review and refine: Monthly analysis of what’s working
- Stress test regularly: Quarterly portfolio stress tests
Remember that perfect risk management doesn’t mean avoiding all losses—it means ensuring no single loss can significantly damage your portfolio, and that your winning trades outpace your losing ones over time.
In my five years of crypto trading, I’ve gone from near account blow-ups to consistent profitability—not because I became a market wizard who predicts every move, but because I built risk management systems that keep me in the game through all market conditions.
The most valuable investment you can make isn’t in any particular cryptocurrency—it’s in developing these risk management skills that will serve you through every bull and bear market to come.